2022. 10. 29. 17:33ㆍ무료강좌&튜토리얼/PHP
[PHP] 설문조사 결과 데이터 차트 만들기 (4/4) - survey 테이블의 데이터를 차트로 보기
이전 포스팅의 그림은 코드에 직접 데이터 값을 입력하여 출력된 값을 주여주고 있었다.
이제 AJAX를 사용하여 파일 [193_surveyResultJson.php] 이 반환하는 JSON 데이터로 차트를 출력하는 방법에 대해 알아보자.
앞에서 생성한 survey 테이블의 JSON 데이터로 bar 차트를 생성하기 위해 AJAX를 사용하며 AJAX코드 안에서 차트의 데이터를 입력하는 방식으로 진행한다.
[예제: 195-1_surveyResultBarChart.php ]
<?php
  include $_SERVER['DOCUMENT_ROOT'].'/php/common/171_session.php';
  include $_SERVER['DOCUMENT_ROOT'].'/php/common/179_checkSignSession.php';
  include $_SERVER['DOCUMENT_ROOT'].'/php/cssControlPanel/163_connection.php';
?>
<!DOCTYPE html>
<html lang="ko">
<head>
  <title>설문조사 데이터 차트로 보기</title>
  <script type="text/javascript" src="https://www.gstatic.com/charts/loader.js"></script>
  <script type="text/javascript">
    google.charts.load('current', {'packages':['corechart','bar']});
    google.charts.setOnLoadCallback(drawChart);

    function drawChart(){

      var xhttp = new XMLHttpRequest();

      xhttp.onreadystatechange = function() {
        if(this.readyState == 4 && this.status == 200){

          result = JSON.parse(this.responseText);
          console.log('result is ' + JSON.stringify(result));

          var data = google.visualization.arrayToDataTable([
            ['종류','명'],
            ['오프라인 서점',result.offlineStore],
            ['온라인 서점',result.onlineStore],
            ['웹사이트',result.website],
            ['지인을 통해서',result.friends],
            ['교육기관',result.academy],
            ['기억이 안남',result.noMemory],
            ['기타',result.etc]
          ]);

          var options = {
            title: '당신은 어떤 경로를 통해 책 정보얻나요?',
            chartArea: {width: '50%'},
            hAxis: {
              minValue: 0
            },
          };

          var chart = new google.visualization.BarChart(document.getElementById('chart_div'));
          chart.draw(data, options);
        }
      };

      xhttp.open("POST", "./193_surveyResultJson.php", true);
      xhttp.send();
    }
  </script>
</head>
<body>
  <div id="chart_div" style="height:500px"></div>
</body>
</html>
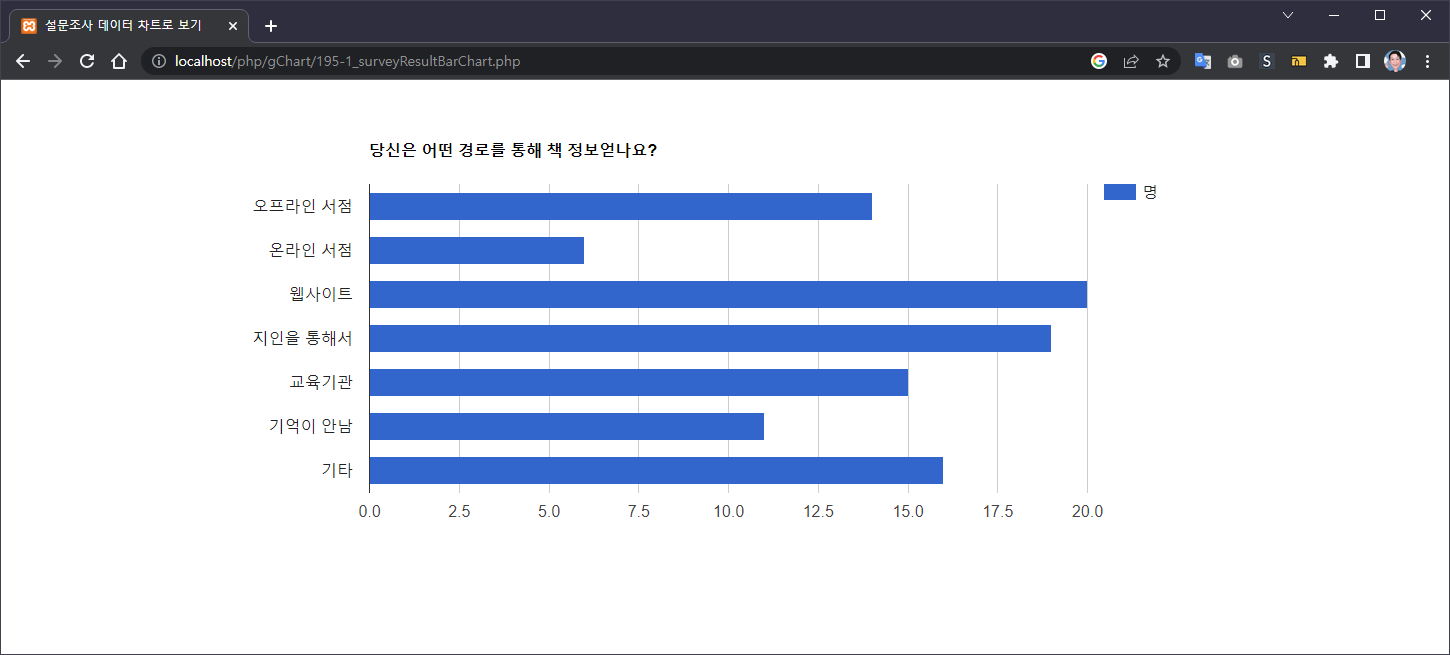
1. AJAX 통신을 통하여 [193_surveyResultJson.php] 파일로부터 반환받은 데이터를 대입한다.
2. 차트에 표시할 데이터를 입력한다.
3. 차트의 옵션을 지정한다.
4. 차트를 표시하는 태그이며, style 속성을 사용하여 세로길이를 500px로 조정한다.
실행 URL은 http://localhost/php/gChart/195-1_surveyResultBarChart.php 이다.
실행결과

그럼 이번에는 survey 테이블의 데이터를 Pie 차트로 표현해보자.
[예제: 195-2_surveyResultPieChart.php ]
<?php
  include $_SERVER['DOCUMENT_ROOT'].'/php/common/171_session.php';
  include $_SERVER['DOCUMENT_ROOT'].'/php/common/179_checkSignSession.php';
  include $_SERVER['DOCUMENT_ROOT'].'/php/cssControlPanel/163_connection.php';
?>
<!DOCTYPE html>
<html lang="ko">
<head>
  <title>설문조사 데이터 차트로 보기</title>
  <script type="text/javascript" src="https://www.gstatic.com/charts/loader.js"></script>
  <script type="text/javascript">
    google.charts.load('current', {'packages':['corechart']});
    google.charts.setOnLoadCallback(drawChart);

    function drawChart(){

      var xhttp = new XMLHttpRequest();

      xhttp.onreadystatechange = function() {
        if(this.readyState == 4 && this.status == 200){

          result = JSON.parse(this.responseText);
          console.log('result is ' + JSON.stringify(result));

          var data = google.visualization.arrayToDataTable([
            ['종류','명'],
            ['오프라인 서점',result.offlineStore],
            ['온라인 서점',result.onlineStore],
            ['웹사이트',result.website],
            ['지인을 통해서',result.friends],
            ['교육기관',result.academy],
            ['기억이 안남',result.noMemory],
            ['기타',result.etc]
          ]);

          var options = {
            title: '당신은 어떤 경로를 통해 책 정보얻나요?',
            chartArea: {width: '50%'},
            hAxis: {
              minValue: 0
            },
          };

          var chart = new google.visualization.PieChart(document.getElementById('piechart'));
          chart.draw(data, options);
        }
      };

      xhttp.open("POST", "./193_surveyResultJson.php", true);
      xhttp.send();
    }
  </script>
</head>
<body>
  <div id="piechart" style="height:500px"></div>
</body>
</html>
위의 Bar 차트를 표시하는 [코드 195-1]과 다른점은 12라인의 배열값과, 44라인의 아이디명 그리고 body 내의 div의 id 속성의 값만 다르다.
실행 URL은 http://localhost/php/gChart/195-2_surveyResultPieChart.php 이다.

초보자를 위한 PHP 200제
김태영 지음 | 정보문화사
'무료강좌&튜토리얼 > PHP' 카테고리의 다른 글
| [PHP] 웹에서 입력한 코드 결과 보기 (1/2) - 코드 입력폼 만들기 (0) | 2022.10.29 |
|---|---|
| [PHP] 설문조사 결과 데이터 차트 만들기 (3/4) - 구글 차트 (0) | 2022.10.29 |
| [PHP] 설문조사 결과 데이터 차트 만들기 (2/4) - survey 테이블의 데이터를 JSON으로 생성하기 (0) | 2022.10.29 |
| [PHP] 설문조사 결과 데이터 차트 만들기 (1/4) - survey 테이블에 임의의 데이터 입력하기 (0) | 2022.10.29 |
| [PHP] 설문조사 프로그램 만들기 (4/4) - 설문조사 결과 확인하기 (0) | 2022.10.29 |